Taxes Drag Our Investment Return by a Big Margin
Dr. Doug Yang
Investment Adviser
How Taxes Drag our Investment Return?
When investing in stocks, bonds, mutual bonds, or ETFs in a taxable account,
most stocks distribute dividend, and most bonds pay income each year that incur taxes.
When money managers of a mutual fund or ETF trade, make adjustment to
index component changes, or even rebalance, capital gains will also be distributed to each shareholder.
In addition to paying taxes on dividend, income, and
capital gain distributions each year, the investor would also pay taxes on
capital gains when the investment is sold at the end of the investment period.
All these taxes will reduce the net investment return of a taxable account.
A recent study from Morningstar shows that the average stock investor loses 2% on growth rate
each year to taxes in a taxable account.
What is Tax Drag Rate?
Tax Drag Rate describes the reduction in the average annual rate of return
due to taxes for a given investment in a taxable account
compared to a tax-free account. It includes the impact of taxes on liquidating the assets at the end of the investment period.
For example, if a stock, bond, mutual fund, or ETF returns an annual rate of 10% in a tax-free account,
but returns 8% in a taxable account, then the tax drag rate for this investment is 2%.
How Much is the Tax Drag Rate?
The tax drag rate for most investors is estimated to be from about 2% to about 3%,
depending on their tax brackets.
Chapter 4 of the book:
Retirement Planning: 401k vs Roth 401k, IRA vs Roth IRA calculates the tax drag rates for
investors in various tax brackets with a diversified portfolio, as shown in the following table.
Historic market data going back to 1939 is used, and the state tax rate of 5% is assumed
which is about the average among all 50 states.
Level 1 is the lowest tax bracket and level 7 is the highest.
For high earners, the Medicare net investment income tax of 3.8% is included.
Here the tax bracket notation [x%/y%; z%] means:
ordinary income tax rate: x% (federal plus state/local)
and long-term capital gain tax rate: y% within the investment period,
and
long-term capital gain tax rate: z% on the sale of shares at the end of the investment.
From this table, for investors in level 3 tax bracket (regular income tax rate of 27%
and long term capital gain tax of 20%), taxes would reduce
their investment return by 1.97% each year.
The tax drag rate is about 3% or more for investors in the top two tax brackets.
The calculation assumes no rebalancing or trade before the end of the
investment term (a buy and hold strategy). Otherwise, the tax drage rate would be higher.
Note that the 3.8% Net Investment Income Tax (NIIT), also called Medicare surtax,
enacted by the Affordable Care Act of 2010, is included for the top three tax brackets.
| Tax Bracket | Tax Drag Rate (federal + state taxes included) |
|---|---|
| Level 1 [15%/5%; 5%] | 0.89% |
| Level 2 [17%/5%; 5%] | 0.98% | Level 3 [27%/20%; 20%] | 1.97% |
| Level 4 [29%/20%; 20%] | 2.07% |
| Level 5 [40.8%/23.8%; 20%] | 2.74% |
| Level 6 [43.8%/23.8%; 23.8%] | 2.92% |
| Level 7 [45.8%/28.8%; 28.8%] | 3.19% |
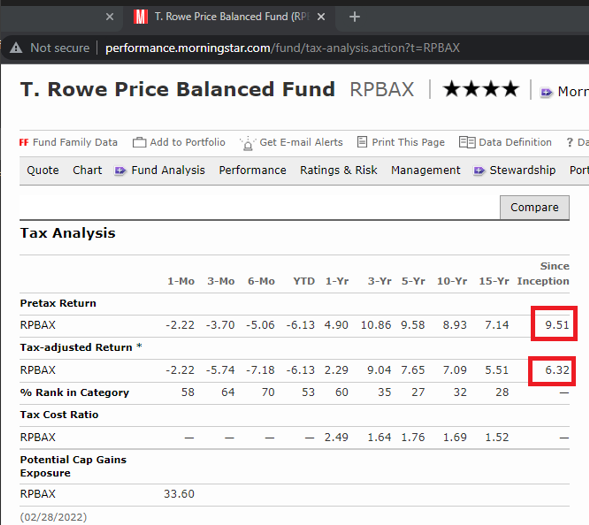
Tax Drag Rate for T. Rowe Price Balanced Fund
The following screenshot is from Morningstar that shows the tax drag rate for T. Rowe Price
Balanced Fund is: 3.19% [= 9.51% (Pretax Return) - 6.32% (Tax-adjusted Return)], from its inception date of
12/29/1939 to 2/28/2022, using the highest federal tax bracket and ignoring state and local taxes.
A diversified portfolio can be simulated by a balanced fund and would lose about
3.19% to taxes each year and every year on average.
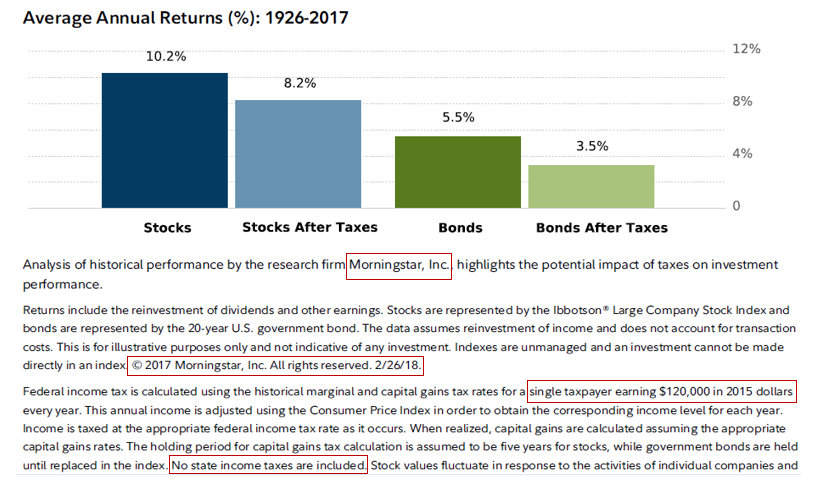
Tax Drag Rate for Stock Investors
A recent study from Morningstar shows that the
average stock investor invested in the large company stock index loses 2% each year to taxes
based on data from 1926 to 2017.
This assumes a buy and hold strategy and any trade would cause more losses to taxes.
Tax Drag Rate for Index ETFs
ETFs are generally considered more tax-efficient than mutual funds. Some people even argue that recent technologies
such as tax-loss harvesting further improve their tax-efficiency. However, ETFs still have
dividend, income, or capital gain distributions that impact their after-tax return.
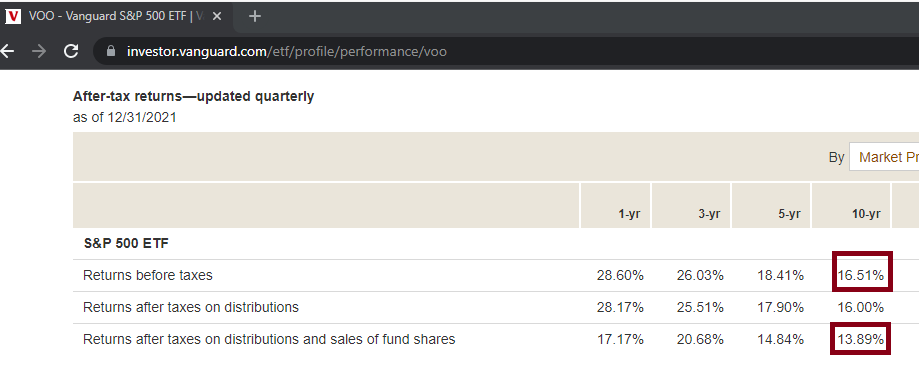
For the past 10 years from 2011-12-31 to 2021-12-31, Vanguard S&P 500 ETF (VOO)
has a tax drag rate of 2.62% [= 16.51% (Returns before taxes) - 13.89% (Returns after taxes on distributions and sales of fund shares)]. Over the past 5 years, taxes have reduced its performance by 3.57% a year on average.
Even worse, its performance is reduced by 5.35% a year by taxes over the past 3 years.
This again assumes a buy and hold strategy and any trade would cause more losses to taxes.
Similarly, iShares Core S&P 500 ETF (IVV) has a tax drag rate of 2.62% during the past 10 years ending 2021-12-31.
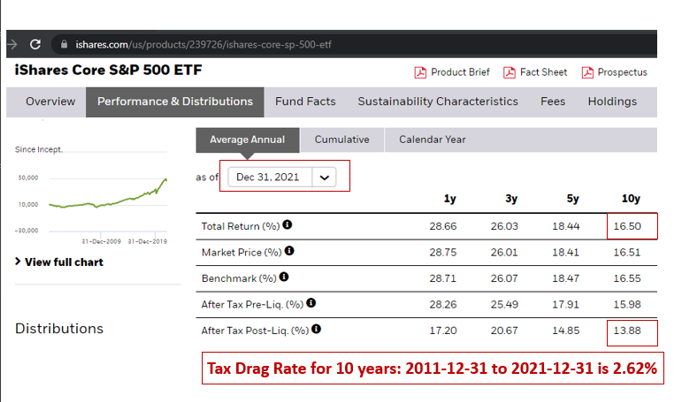
Similarly, iShares Core S&P 500 ETF (IVV) has a tax drag rate of 2.62% during the past 10 years ending 2021-12-31.
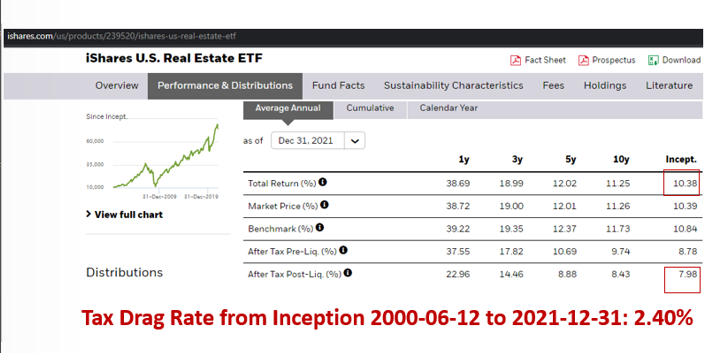
Tax Drag Rate for Real Estate ETFs
Sector and actively managed ETFs are typically not tax-efficient.
In particular, high dividend and real estate
ETFs generally incur a lot of taxes. For example,
iShares U.S. Real Estate ETF (IYR) loses 2.40% to taxes each year from its inception date:
2000-06-12 to 2021-12-31.
Note: individual real estate investing through rental income should be as tax-inefficient as real estate mutual funds or ETFs, since their main differences are the scale of the business and individual vs professional management.
Note: individual real estate investing through rental income should be as tax-inefficient as real estate mutual funds or ETFs, since their main differences are the scale of the business and individual vs professional management.
How Much Does an Investor Lose to Taxes?
If an investor loses 2% or 3% each year to taxes,
how much money does he lose in 10, 20, 30, or 40 years, assuming an initial
investment of $100,000 and a pretax growth rate of 8%?
This table shows the account balances of each account. An investor could lose hundreds of thousands of dollars to taxes over the long term, due to
tax inefficiencies in their taxable investments.
With record high national debt, our tax rates will likely go up soon and reduce our net investment returns significantly.
| Year | Tax-Free Account | Tax Drag: 2.0% | Tax Drag: 3.0% |
|---|---|---|---|
| 10 | $215,892 | $179,084 | $162,889 |
| 20 | $466,095 | $320,713 | $265,329 |
| 30 | $1,006,265 | $574,349 | $432,194 |
| 40 | $2,172,452 | $1,028,571 | $703,998 |
How to Reduce Taxes in Taxable Investments?
Tax-advantaged investing has the potential to increase the after-tax and after-cost
return by a big margin for many investors. If you have maxed out your contributions
to 401k/HSA/IRA-type retirement
accounts, there are still multiple strategies to utilize for tax-deferred growth which can potentially save
a lot of taxes and improve your net investment return over the long term.
We use the net investment return rate, on after-tax and after-cost basis, to measure the effectiveness of an investment strategy.
If you are interested in knowing more on such strategies,
please contact us to schedule a private and free consultation. We provide individualized analysis
and recommend the best strategies to fit your personal situation.
This page is for general information only and is not intended to provide specific advice for any individual. All performance referenced is historical and is no guarantee of future results. Investing involves risks including possible loss of principal.